Monitor runtime health
Once you provision a runtime to a device, the Portal continuously reports its health. The runtime list and the device overview show process indicators that update so you can see at a glance whether a runtime has crashed or stopped responding.
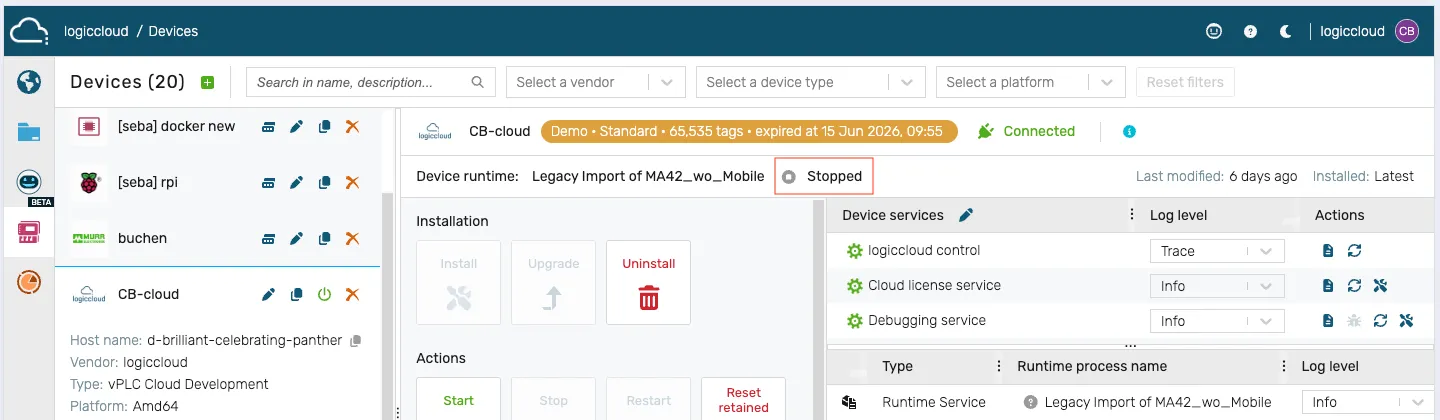
Read the runtime status
Section titled “Read the runtime status”- Open the device overview in the Portal (Devices → select the device). The same status indicator also appears next to each runtime under the Runtimes node in the IDE project tree.
- Each runtime shows a colored status indicator with a label:
- Started (green) — the runtime process is alive and the PLC cycle is running.
- Stopped (grey) — the runtime is installed but not executing.
- Error (red) — the process has crashed or reported a fault.
- Suspended (orange) — the runtime is paused.
- Starting… / Stopping… / Preparing… (animated) — a lifecycle transition is in progress.
- Not installed / Unknown (grey) — the runtime has not been provisioned, or its state cannot currently be determined (for an offline device the indicator shows the last known state).
- Open the device overview for more detail. The Metrics section and the Activity log provide additional context when a runtime has faulted or restarted.